Energy · Web App
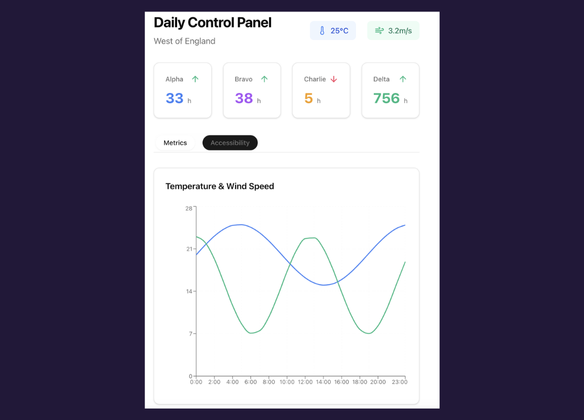
A Dashboard That Tells an Operator When to Run
Energy cost is a timing problem wearing a volume costume. We built a consumption dashboard that turns usage data into scheduling decisions.
The bill was the reporting system
Consumption data existed, but insight arrived at month-end as an invoice. By then every expensive decision had already been made.
Heavy operations ran on habit
Energy-intensive processes were scheduled by routine, not by price or load, landing in peak windows nobody chose deliberately.
Consumption tracking in one view
Live and historical usage across the distribution network, finally in one place.
Forecast-aware recommendations
The dashboard analyses forecasted usage against historical consumption and surfaces the optimal windows for specific operations.
Decision-grade reporting
Trends and anomalies reach the people who can act on them, before the invoice does.
The team plans energy-intensive work around data instead of reacting to bills. Timing stopped being an accident.
YOUR PROJECT, NEXT
Tell us what you’re building.
Talk through your project with Harsh.